-
Courses
Courses
Choosing a course is one of the most important decisions you'll ever make! View our courses and see what our students and lecturers have to say about the courses you are interested in at the links below.
-
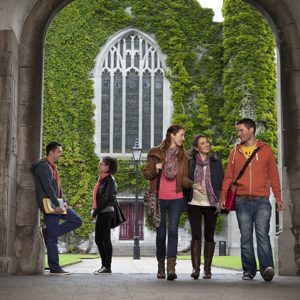
University Life

University Life
Each year more than 4,000 choose University of Galway as their University of choice. Find out what life at University of Galway is all about here.
-
About University of Galway
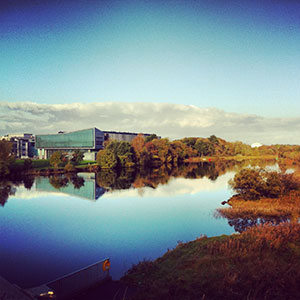
About University of Galway
Since 1845, University of Galway has been sharing the highest quality teaching and research with Ireland and the world. Find out what makes our University so special – from our distinguished history to the latest news and campus developments.
-
Colleges & Schools
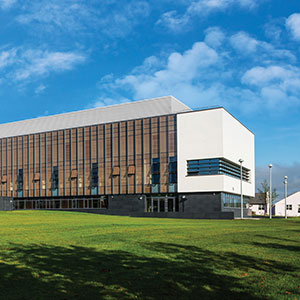
Colleges & Schools
University of Galway has earned international recognition as a research-led university with a commitment to top quality teaching across a range of key areas of expertise.
-
Research & Innovation

Research & Innovation
University of Galway’s vibrant research community take on some of the most pressing challenges of our times.
-
Business & Industry
Guiding Breakthrough Research at University of Galway
We explore and facilitate commercial opportunities for the research community at University of Galway, as well as facilitating industry partnership.
-
Alumni & Friends

Alumni & Friends
There are 128,000 University of Galway alumni worldwide. Stay connected to your alumni community! Join our social networks and update your details online.
-
Community Engagement
Community Engagement
At University of Galway, we believe that the best learning takes place when you apply what you learn in a real world context. That's why many of our courses include work placements or community projects.


Trends in Health Outcomes Data Visual
![]() HEALTH BEHAVIOUR IN SCHOOL-AGED CHILDREN (HBSC) IRELAND
HEALTH BEHAVIOUR IN SCHOOL-AGED CHILDREN (HBSC) IRELAND
World Health Organization Collaborative Cross-National Study
The Health Behaviour in School-aged Children (HBSC) survey is a WHO collaborative cross-national study that monitors the health behaviours, health outcomes and social environments of school-aged children every four years. HBSC Ireland surveys school-going children aged 9-18 years. The study is conducted by the HBSC Ireland team, based at the Health Promotion Research Centre, University of Galway.
Trends in Health Outcomes 1998-2018
Headache
Children were asked how often they experienced headaches in the last six months. The response options ranged from ‘rarely or never’ to ‘about every day’. The findings in this viisual present the percentage of children who reported experiencing headaches about every week or more frequently over the last six months.
Feeling low
Children were asked how often they experienced feeling low in the last six months. The response options ranged from ‘rarely or never’ to ‘about every day’. The findings in this visual present the percentage of children who reported experiencing feeling low about every week or more frequently over the last six months.
Times injured
Children were asked how many times they had been injured and had to be treated by a doctor or nurse during the past 12 months. The response options ranged from ‘I was not injured in the past 12 months’ to ‘4 times or more’. The findings in this visual present the percentage of children who reported having been injured once or more frequently and requiring medical attention.
Self-rated health
Children were asked how they would describe their health. The response options were ‘poor’, ‘fair’, ‘good’ and ‘excellent’. The findings in this visual present the percentage of children who reported their health as excellent.
Happy with life at present
Children were asked how they feel about their life at present. The response options ranged from ‘not happy at all’ to ‘very happy’. The findings in this visual present the percentage of children who reported feeling very or quite happy about their life at present.
Life satisfaction
Children were asked to rate their life satisfaction on a scale from ‘0’ (the worst possible life) to ‘10’ (the best possible life). The findings in this visual present the percentage of children who reported high life satisfaction (a score of 7 or more).
The interactive data visual below will update based on the tab selected (at the top of the visual) and items selected in the legend on the right.
- Select an indicator from the drop down list at the top right
- Check or uncheck any items in the legends on the right to filter/highlight the data
- Hover over the chart to see a pop-up with further information
- Clicking within the chart will also highlight data; use ctrl & click to highlight multiple data
- Click the icons at the bottom of the visual to:
 reset (return the visual to the default setting)
 share (get a URL link and embed code)
 download a version of the visual
 view the visual in full screen mode