-
Courses

Courses
Choosing a course is one of the most important decisions you'll ever make! View our courses and see what our students and lecturers have to say about the courses you are interested in at the links below.
-
University Life

University Life
Each year more than 4,000 choose University of Galway as their University of choice. Find out what life at University of Galway is all about here.
-
About University of Galway

About University of Galway
Since 1845, University of Galway has been sharing the highest quality teaching and research with Ireland and the world. Find out what makes our University so special – from our distinguished history to the latest news and campus developments.
-
Colleges & Schools
Colleges & Schools
University of Galway has earned international recognition as a research-led university with a commitment to top quality teaching across a range of key areas of expertise.
-
Research & Innovation

Research & Innovation
University of Galway’s vibrant research community take on some of the most pressing challenges of our times.
-
Business & Industry

Guiding Breakthrough Research at University of Galway
We explore and facilitate commercial opportunities for the research community at University of Galway, as well as facilitating industry partnership.
-
Alumni & Friends

Alumni & Friends
There are 128,000 University of Galway alumni worldwide. Stay connected to your alumni community! Join our social networks and update your details online.
-
Community Engagement
Community Engagement
At University of Galway, we believe that the best learning takes place when you apply what you learn in a real world context. That's why many of our courses include work placements or community projects.


Fluid Inclusions
Fluid Inclusion Research.
|
|
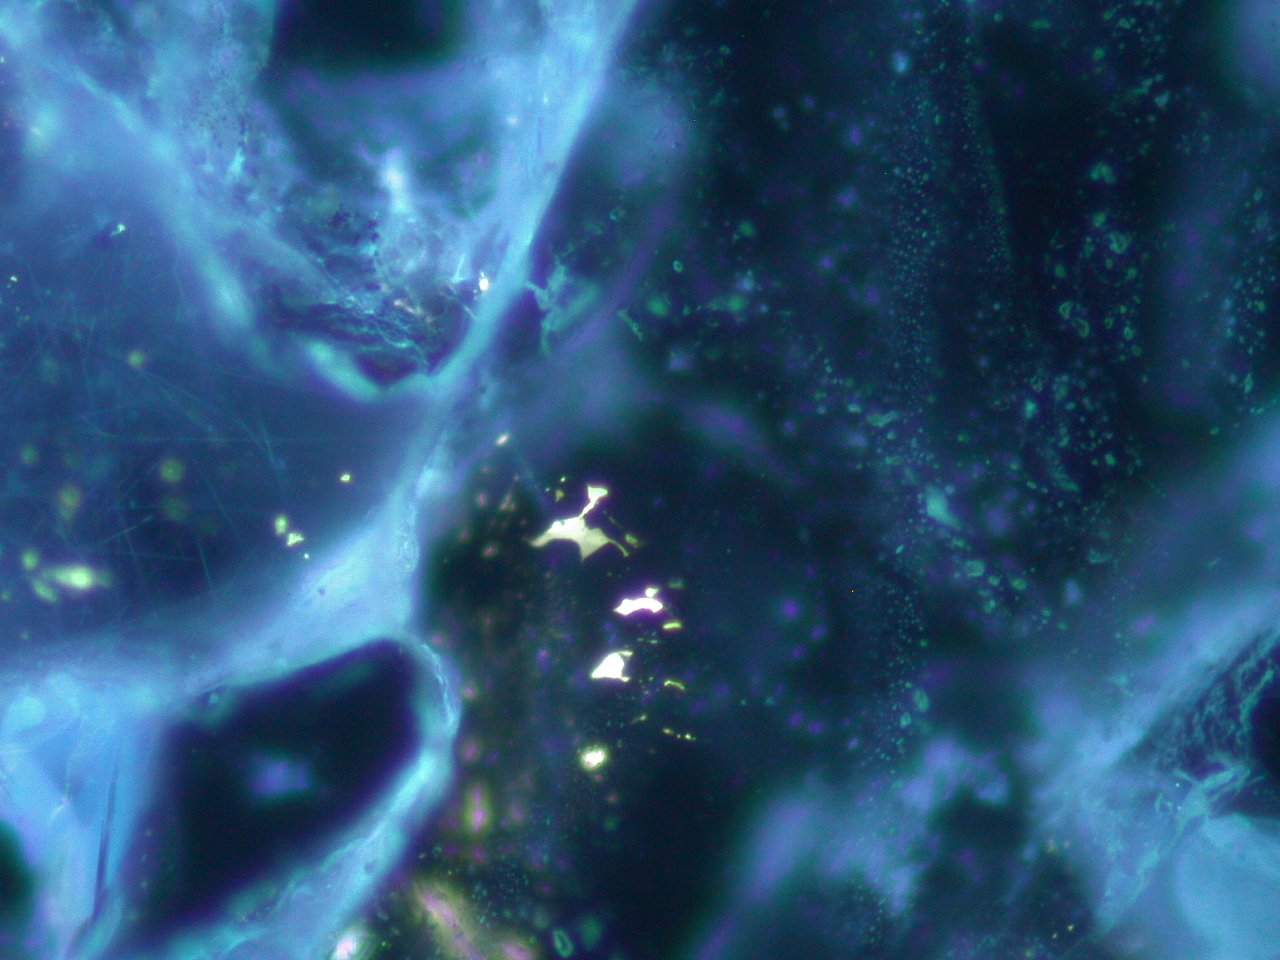
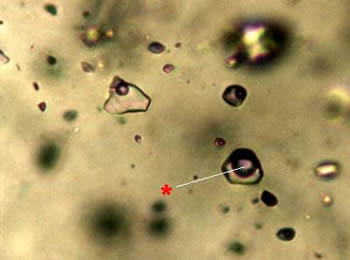 Some typical fluid inclusions. The marked bubble contains both carbon dioxide and methane.
 Fluid Inclusions (introduction):
Fluid inclusions are tiny (microscopic) bubbles of fluid that are found within rocks. They can contain a wide variety of materials (liquid, gases, solids) and are of interest to Geologists for a variety of reasons which are outlined below.
Fluid inclusion studies stem from discoveries made during the last century, notably by H.C.Sorby, who concluded that fluid inclusions in mineral crystals represent trapped portions of the mother liquid from which the crystal grew. His fellow earth scientists did not agree with this proposal and held the view that it was not scientific to study mountains by peering down microscopes. As a result substantial advances in fluid inclusion research only commenced during the early 1950's.
Fluid inclusions occur in natural crystals and can be simply considered as sealed microscopic (usually < 50 microns in longest dimension) vacuum flasks that contain a sample of fluid trapped during (or after) formation of the host crystal. Solid, liquid and vapour phases are commonly observed in fluid inclusions under the petrological microscope. Determination of the chemistry of the fluid components trapped in the crystal cavity provides fundamental information, which will facilitate the reconstruction of the conditions of mineral growth. Fluid inclusion studies provide geological information of fundamental importance to the petroleum exploration and production industry. First, petrographical and microthermometric studies of fluid inclusions provide the essential chemical data on the fluids which have moved through a stratigraphic succession. Secondly, microthermometric analysis of fluid inclusions provides an estimate of fluid trapping temperature and of fluid density. These types of data can then be used in the generation of models that chart the evolution of sedimentary basins with particular reference to:
(a) temperature, age and duration of mineral cement growth,
(b) temperature and timing of episodes of fluid migration (e.g. water, oil, gas) and
(c) temperature of fracture healing.
The data on oil composition derived from fluid inclusions by crushing or decrepitation techniques all suffer from one problem: the data is collected as a bulk analysis of the rock or mineral sample. The most volumetrically abundant oil inclusions are analysed. Even where extensive optical studies are done to determine the type and nature of the inclusions there is no way to relate those studies to which inclusions actually contributed to the bulk analysis. In many instances, rock samples contain more than one type of oil bearing inclusion due to multiple oil migrations and/or different sources of oil.
Currently, the use of fluorescence colour for the general discrimination of oil bearing fluid inclusions is the most prevalent method of analysis. At a recent international meeting of hydrocarbon fluid inclusion specialists held in NUI, Galway and organized by M. Feely (Mineralogical Society of Great Britain and Ireland, Spring meeting 7-8th April 1999) several presentations and discussions centered on ambiguities associated with the interpretation of fluorescence colours of hydrocarbons trapped in mineral inclusions.
References:
R. K. McLimans, The application of fluid inclusions to migration of oil and diagenesis in petroleum reservoirs, Applied Geochemistry, 2, 585-603, (1987).
X. Wang and O. C. Mullins, Fluorescence Lifetime Studies of Crude Oils, Applied Spectroscopy, 48(8), 977-984, (1994).
Spectroscopy of fluid inclusions:
In the NBL we undertake both Raman and Fluorescence measurements of inclusions. The Raman data gives information on the molecular constituents of minerals and the contents of inclusions. Raman is useful because it is a non-contact and non-destructive analysis method, and it can analyse features down to approximately 1 micron in size. Fluorescence spectroscopy is used to probe the constituents of crude oils entrapped in inclusions.
Galway Granite: Carbonic fluid inclusion, gaseous CO 2, surrounded by liquid CO 2 and then aqueous solution. The distinctive double bubble is evident in the video image. The image on the left is a Raman map of the same inclusion. In this image we have mapped the intensity of the Quartz 1160 cm -1 band, the lowest intensity (blue) corresponds to the area of the inclusion.
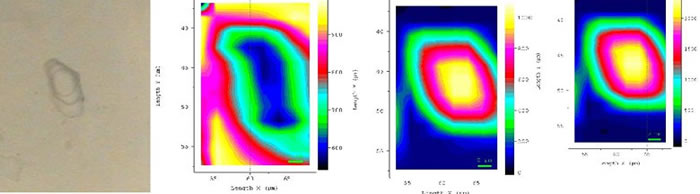
While interesting....looking at the quartz bands isn't very useful, the two Raman images on the right are based on CO 2 Raman
bands at 1388 and 1285 cm -1. The highest concentrations of CO 2 are represented by the yellow colours.
 The Raman spectrum (left) was taken from the centre of the CO 2 bubble within the inclusion. The 1388 and 1285 cm -1 bands due to CO 2 are easily distinguished. The Raman spectrum below was taken from just outside the fluid inclusion and shows the bands due to quartz. All the above spectra were obtained using 633 nm excitation.
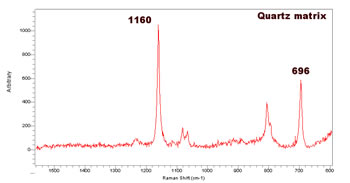
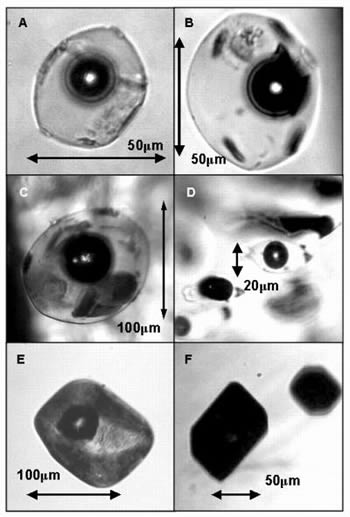 The image on the left shows six different petroleum bearing fluid inclusions that were analysed using the DLFLM system.
(A - D): Inclusions in Fluorite, Cave in Rock, Illinois, USA.
(E): Quartz, Baltic quarry, South Wales.
(F): Quartz, La Riqueza, Argentina.
Using 405 nm excitation, average fluorescence lifetimes were measured using the DLFLM system. Sample A yielded lifetimes in the 5-11 nanosecond range, with the maximum lifetime occurring at ~650 nm. For B-D the lifetimes ranged from 3 to 14 ns, with the longest lifetimes occurring at >600 nm. Sample E has lifetimes between 7.5 and 12 ns, with the maximum at ~550 nm. The solid sample F, has very weak fluorescence and short lifetimes of less than 1 ns.
Time-resolved fluorescence microspectroscopy for characterizing crude oils in bulk and hydrocarbon bearing fluid inclusions. A.G. Ryder, M.A. Przyjalgowski, M. Feely, B. Szczupak,and T.J. Glynn, Applied Spectroscopy , 58(9), 1106-1115, (2004). DOI: 10.1366/0003702041959505
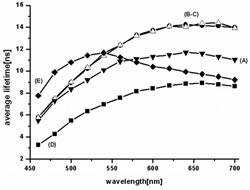 The plot above left shows the average fluorescence lifetime versus emission wavelength for 5 of the inclusions. The different changes in lifetime with emission wavelength are indicative of different oil compositions.
Hydrocarbon containing Fluid inclusions have been provided by: John Parnell at the University of Aberdeen; Stan Perry Our Gangue Minerals;
Imaging of inclusions for analysis:
The location and morphological analysis of inclusions requires the use of conventional white light and fluorescence imaging. We have recently explored the use of Structured Light Illumination (SLI) for confocal like imaging of wafers containing hydrocarbon bearing fluid inclusions (HCFI). SLI is a simple method that allows one to generate 3D movies of inclusion planes more rapidly than conventional Confocal Laser Scanning Microscopy (CLSM).
|
The 3D data sets can be used to measure volumes within HCFI. The image (left) shows a slice from a 3D image of a 50 micron HCFI clearly showing the vapour bubble (false coloured in red) and a non-fluorescent solid component (black area within The application of structured-light illumination to hydrocarbon-bearing fluid inclusions. N.J.F. Blamey, A.G. Ryder, M. Feely, P. Dockery, and P. Owens, Geofluids, 8(2), 102-112, (2008). DOI: 10.1111/j.1468-8123.2008.00209.x The geological application of structured-light illumination microscopy: An example using hydrocarbon-bearing fluid inclusion fluorescence. N.J.F. Blamey, A.G. Ryder, P. Owens, M. Feely, and P. Dockery. InFocus Magazine, 5(Mar.), 85-86, 2007. |
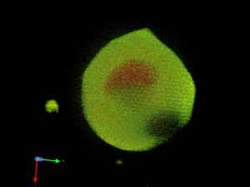 inclusion).
 |
For a typical example one might acquire 40 z stack images in a couple of minutes. These images can then be used to generate 3D movies showing the orientation of inclusion veils. |
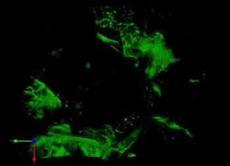 The image (left) shows the type of image possible using SLI. It is a confocal slice through a sample wafer showing some small HCFI (small oval shapes) surrounded by sheet fluorescence. The key point is that this image can be reconstructed (at any viewing) from a series of image stacks acquired in the vertical (z) direction.
Fluorescence Lifetime Imaging Microscopy (FLIM) of inclusions:
FLIM is being used to develop a quantitative analytical method for the characterisation of HCFI. It has many advantages over conventional fluorescence microscopy, such as being relatively insensitive to intensity fluctuations, photobleaching, human interpretation, and variations in instrument design. The montage below illustrates this: top left shows a transmitted white light image of a multiphase inclusion (gas, vapour, solid), the image top right is a confocal fluorescence intensity image. Bottom left is a FLIM image of the same inclusion, while bottom right shows the lifetime distribution analysis of the FLIM image.
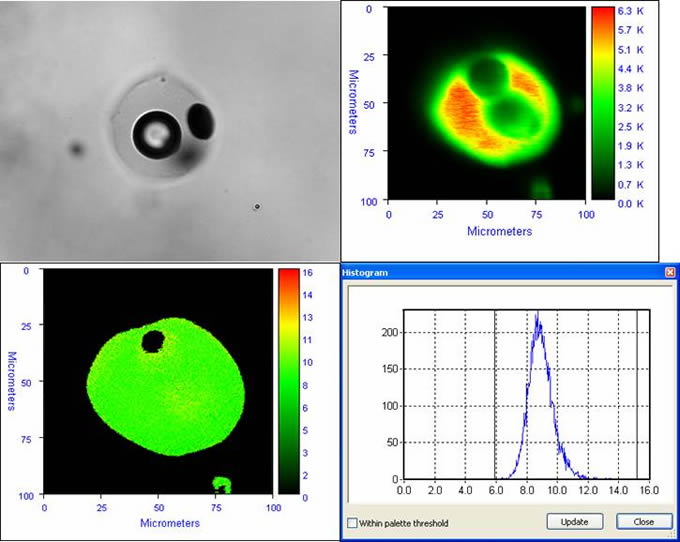
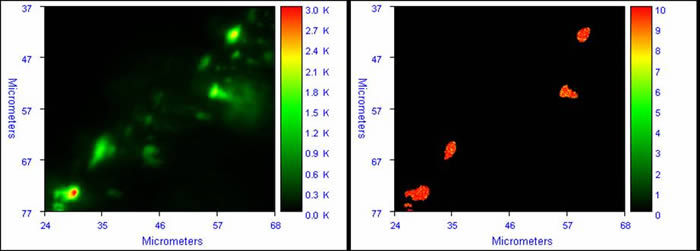
This image shows how FLIM can screen out intensity based artifacts, and in this case show that the hydrocarbon fluid in the inclusion is homogeneous. We make use of this fact for the analysis of multiple inclusions in trails, where FLIM data can prove that the oil is the same or different, irrespective of the apparent colour of the inclusion. The image below shows the intensity image (left) and the FLIM image (right) for a series of inclusions.
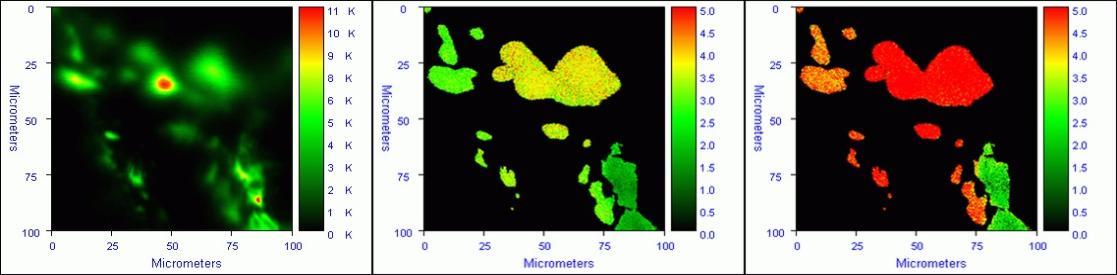
The tri-part image above shows the output from the phase modulation based FLIM system (ISS Alba). The image on the left is the fluorescence intensity image, the middle image is the phase map, and the right hand image the modulation map. The phase and modulation data are used to calculate the lifetime, here it varies from ~1 to ~5 ns.
Equipment for inclusion analysis:
This is a list of some of the equipment we have used for the analysis of hydrocarbons and for the spectroscopic interrogation of microscopic fluid inclusions.
Micro-Spectroscopy:
We undertook two different types of micro-spectroscopy:
- Raman microscopy: using a Jobin-Yvon LabRam Infinity system with a 785 nm excitation source, which is located in R166 School of Chemistry. This is used for mineralogy and the analysis of aqueous fluid inclusions.
- Raman spectral Mapping: An Avalon Instruments (Now part of Perkin-Elmer) RamanStation can be used to map larger areas using 785 nm excitation.
- Fluorescence Lifetime Imaging Microscopy (FLIM): using an upright ISS Alba system equipped with a 405 and 635 nm laser diode excitation sources. The system is equipped with a range of options which is detailed on the equipment page. We have collected a range of lifetime information using this system on inclusions from Colombia, Porcupine Basin, South Africa, and Tunisia.
- ICCD-FLIM: We also use a wide angle fast gated ICCD camera on an upright BX microscope to image fields of inclusions. This provides FLIM data.
- Thorlabs Confocal: Another confocal system arrived in May 2008 which can be used for FLIM and conventional imaging of inclusions.
Microscopy & Microthermometry:
The microthermometry systems ( Dept. of Earth & Ocean Sciences) are based around Nikon microscopes with Linkam heating-freezing stages. Polarizing microscopes and digital imaging are also available.
For the SLI studies we used an OptiGrid system with Velocity software (Improvision) attached to an Olympus upright microscope, this system is located in the Department of Anatomy and the work was a collaboration with Prof. Peter Dockery.
|
|
Emma undertook an M.Sc. degree which involved developing quantitative fluorescence models for the analysis of bulk crude petroleum oils. |
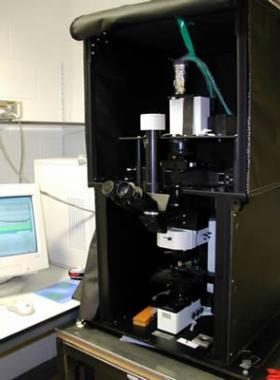
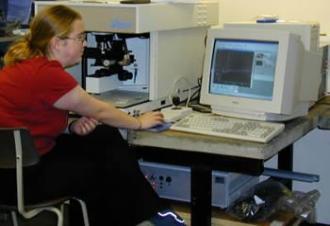 The image on the left shows Emma Murray-Hayden using the Raman instrument for the analysis of carbonic fluid inclusions. The confocal nature of the instrument allows for the very precise chemical mapping of fluid inclusions. This system was fitted with both 785 and 488 nm excitation sources and a liquid nitrogen cooled CCD.
Publications & Research Grants:
The following articles have been published on HCFI analysis:
- Hydrocarbon migration in Jurassic sandstones from the Porcupine Basin, offshore Ireland: evidence from fluid inclusion studies. Conliffe J., Feely M., Parnell J., Blamey N., and Ryder A.G., Petroleum Geoscience, 16(2), 67-76, (2010). DOI: 10.1144/1354-079309-007 The cover image for the issue features the inclusions analysed in this paper.
- A multi-charge history in North Atlantic petroleum reservoirs as indicated by fluorescence lifetime measurements on hydrocarbon-bearing fluid inclusions. Blamey NJF, Conliffe JF, Parnell J, Ryder AG, and Feely M, Geofluids, 9, 330-337, (2009). DOI: 10.1111/j.1468-8123.2009.00265.x
- The application of structured-light illumination to hydrocarbon-bearing fluid inclusions. N.J.F. Blamey, A.G. Ryder, M. Feely, P. Dockery, and P. Owens, Geofluids, 8, 102-112, (2008). DOI: 10.1111/j.1468-8123.2008.00209.x
- Analysis of hydrocarbon bearing fluid inclusions (HCFI) using time-resolved fluorescence spectroscopy. M.A. Przyjalgowski, A.G. Ryder, M. Feely, and T.J. Glynn. Proc SPIE - Int. Soc. Opt. Eng., 5826, 173-184, (2005). [ full paper]
- Time-resolved fluorescence microspectroscopy for characterizing crude oils in bulk and hydrocarbon bearing fluid inclusions. A.G. Ryder, M.A. Przyjalgowski, M. Feely, B. Szczupak,and T.J. Glynn, Applied Spectroscopy , 58(9), 1106-1115, (2004).
- A compact violet diode laser based fluorescence lifetime microscope. A.G. Ryder, T.J. Glynn, M. Przyjalgowski, B. Szczupak. Journal of Fluorescence, 12(2), 177-180, (2002). DOI: 10.1366/0003702041959505
The following abstracts on HCFI analysis by fluorescence lifetimes have also been published:
- Single Hydrocarbon-Bearing Fluid Inclusion Analysis Using Fluorescence Lifetime Measurements in the Frequency Domain. A.G. Ryder, N.J.F. Blamey, P. Owens, and M. Feely. InFocus Magazine, 8(Dec.), 105, 2007.
- Fluorescence lifetime analysis of single hydrocarbon-bearing fluid inclusions: A paragenetic perspective. N.J.F. Blamey, A.G. Ryder, M. Feely, and P. Owens, IMOG, 669-670, (2007).
- The geological application of structured-light illumination microscopy: An example using hydrocarbon-bearing fluid inclusion fluorescence. N.J.F. Blamey, A.G. Ryder, P. Owens, M. Feely, and P. Dockery. InFocus Magazine, 5(March), 85-86, (2007).
- Application of multi-frequency phase and modulation fluorometry to lifetime analysis of petroleum oils. P. Owens, N.J.F. Blamey, and A.G. Ryder. InFocus Magazine, 5(March), 88-89, (2007).
- Fingerprinting of Crude Petroleum Oils in Bulk form and in Fluid Inclusions, using Time-Resolved Fluorescence Microscopy. M. Przyjalgowski, A.G. Ryder, M. Feely , and T.J. Glynn. Irish Journal of Earth Sciences, 21, 160, (2003). 46th Annual Irish Geological Research Meeting 2003, Belfast, 21-23 Feb., 2003.
- Preliminary studies with a diode laser-based fluorescence lifetime microscope: a new measurement methodology for petroleum bearing fluid inclusions. M. Przyjalgowski, A. Ryder, B. Szczupak, T.J. Glynn, M. & Feely, M. Irish Journal of Earth Sciences, 20, 98-99, (2002). 45th Annual Irish Geological Research Meeting 2002, Dublin, 22-24 Feb., 2002.
- Fluorescence lifetime (FL) measurements of crude oils: towards the in-situ characterization of oil-bearing fluid inclusions. E. Murray-Hayden, A.G. Ryder, and M. Feely. Irish Journal of Earth Sciences, 20, 96, (2002). 45th Annual Irish Geological Research Meeting 2002, Dublin, 22-24 Feb., 2002.
- Raman Microscopy and the Analysis of Microscopic Fluid Inclusions. A.G. Ryder, M. Feely, R. Moran, G.M. O'Connor, & T.J. Glynn. Supplement to Proceedings of the Royal Microscopical Society, (2), (1999). [ Abstract] Microscopical Society of Ireland's 22nd Annual Symposium, NUI-Galway, 2-3 Sept., 1998.
Our work on fluorescence lifetime analysis of HCFI has also been presented at many conferences:
- A quantitative non-destructive Fluorescence Lifetime Microscopy (FLIM) method for the analysis of single hydrocarbon-bearing fluid inclusions: discrimination of petroleum multi-charge histories. N.J.F. Blamey, A.G. Ryder, M. Feely, P. Owens, and J. Parnell. PACROFI IX, Ninth Pan-American Current Research on Fluid Inclusions Conference, UCGS Headquarters, Reston, Virginia, USA, 2-5 June, 2008.
- The frequency domain approach to fluorescence lifetime analysis of single hydrocarbon-bearing fluid inclusions. N. Blamey, A.G. Ryder, P. Owens, and M. Feely. Photonics Ireland 2007, Galway Bay Hotel, Salthill, 24-26 Sept. 2007.
- Fluorescence lifetime analysis of single hydrocarbon-bearing fluid inclusions – a paragenetic perspective. N. J.F. Blamey, A.G. Ryder, M. Feely, and P. Owens. 23rd International Meeting on Organic Geochemistry (IMOG), Torquay , UK , 9 -14 Sept., 2007. [Abstract available here]
- Single hydrocarbon-bearing fluid inclusion analysis using fluorescence lifetime measurements in the frequency domain. A.G. Ryder, N.J.F. Blamey, P. Owens, and M. Feely. Microscopical Society of Ireland 's 31st Annual Symposium, University of Limerick , Ireland, 22-24 Aug., 2007.
- Fluorescence lifetime measurements of single hydrocarbon-bearing fluid inclusions. N.J.F. Blamey, A.G. Ryder, P. Owens, M. Feely, and J.F. Naranjo-Vesga. (ECROFI-XIX) European Current Research on Fluid Inclusions, Bern , Switzerland , 17-20, July, 2007.
- Fluorescence Lifetime Imaging Microscopy for the analysis of Hydrocarbon bearing Fluid Inclusions, the frequency domain approach. A. Ryder, N. Blamey, P. Owens, and M. Feely. 7th International ELMI meeting, York, England, 17-20 April, 2007.
- Preliminary fluorescence lifetime measurements on hydrocarbon-bearing fluid inclusions from the Porcupine Basin , offshore Western Ireland . N. Blamey, A. Ryder, M. Feely, and P. Owens, 50th Annual Irish Geological Research Meeting, University of Ulster, Coleraine, 23-25 Feb., 2007.
- The geological application of structured-light illumination microscopy: An example using hydrocarbon-bearing fluid inclusion fluorescence. N.J.F. Blamey, A.G. Ryder, P. Owens, M. Feely, and P. Dockery. Microscopical Society of Ireland's 30th Annual Symposium , NUI-Galway, 30 Aug.-1 Sept., 2006.
- Analysis of hydrocarbon bearing fluid inclusions (HCFI) using time-resolved fluorescence spectroscopy, M. A. Przyjalgowski, A. G. Ryder, M. Feely, T. J. Glynn, OptoIreland RDS Dublin, Ireland, 4-6 April, 2005.
- Time-resolved fluorescence microspectroscopy for characterizing crude oils in microscopic hydrocarbon bearing fluid inclusions. A. Ryder, M.A. Przyjalgowski, and M. Feely, Microscopical Society of Ireland's 28th Annual Symposium, TCD, Dublin, 1-3 Sept., 2004. [Invited]
- Fluorescence Lifetime Analysis of Fluid Inclusions, A.G. Ryder, M.A. Przyjalgowski, and M. Feely, New Exploration Opportunities in Ireland: Technical Exhibition & Workshop, Dublin, 27-28 July, 2004.
- Nanoscale Photonics: crude oil & fluid inclusions, a case of geological biophotonics? A.G. Ryder, 4th Stokes Summer School, Skreen, Co. Sligo, Ireland, 18-22 June, 2004.
- Towards non-destructive characterization of hydrocarbon bearing fluid inclusions using time-resolved fluorescence (TRF) microscopy. M.A. Przyjalgowski, A.G. Ryder, M. Feely, and T.J. Glynn. 47th Annual Irish Geological Research Meeting 2004, NUI-Galway, 20-22 Feb., 2004.
- The first nanosecond time-resolved fluorescence studies of hydrocarbon bearing fluid inclusions using a diode laser based fluorescence lifetime microscope. M. Przyjalgowski, A.G. Ryder, M. Feely, B. Szczupak, & T.J. Glynn. Microscopical Society of Ireland's 27th Annual Symposium, UCC, Cork, 10-12 Sept., 2003.
- Time-resolved fluorescence spectroscopy for characterising crude oils in bulk and fluid inclusions. A.G. Ryder, M. Przyjalgowski, M. Feely, T.J. Glynn. IMOG (International Meeting of Organic Geochemists) 2003, Krakow, Poland, 8-12 Sept., 2003. [pdf of poster available here]
This research has been financed and supported by a variety of agencies and grants. They include:
- “Time-resolved fluorescence spectroscopic analysis of petroleum oils and hydrocarbon bearing fluid inclusions.” SFI Research Frontiers Programme, (05/RFP/GEO0002), 2005-2008, with Martin Feely, Department of Earth & Ocean Sciences. This project has explored and developed novel Time-resolved fluorescence methods for the quantitative analysis of fluid inclusions. Dr. Nigel Blamey was the postdoc. on the project and Peter Owens M.Sc. was the graduate student.
- "Analysis of microscopic oil-bearing fluid inclusions by the measurement of ultra-fast fluorescence lifetimes", M. Feely ( Geology), A. Ryder & Prof. T. Glynn (Physics). Millennium Research Fund 1999-2001, NUI, Galway. This award provided for the purchase of fast pulsed laser diodes & LED's and Time Correlated Single Photon Counting (TCSPC) detection and counting electronics to enable the measurement of fluorescence lifetimes of < 200 ps. A portable system for the analysis of bulk hydrocarbon and materials was been assembled from these components and was in constant operation on this and several biomedical projects.
- "PAD/Marathon/Occidental/Phillips Scholarship Scheme (2000-2002)", This provided funding for an M.Sc. student (Ms. Emma Murray-Hayden) to work on the analysis of fluid inclusions.
- "Development of spectroscopic methods for the chemical characterization of petroleum bearing microscopic fluid inclusions", Forbairt Post-doctoral research fellowship 1998-2000. This was invaluable in helping to develop this integrated approach to fluid inclusion research.
- "Development of a Confocal Raman Microscope for Geochemical Applications", M. Feely (Geology), A. Ryder & Prof. T. Glynn (Physics)., Forbairt Basic Research grant 1998-2000.
Fluid Inclusion links:
Fluid inclusions sites:
World of Fluid Inclusions, (Phil Brown at University of Wisconsin-Madison )
Fluorescent Mineral Society,
Petroleum and Aqueous Fluid Inclusion Research, at CREGU (Nancy France), very good site.
Fluid Inclusion Analysis, Norman Oxtoby's site (no access present).
Geofluids Research Group, University of Aberdeen. John Parnell's group.
Links for Mineralogists, at University of Wuerzburg.
Spectroscopy:
David Sullivan FT-IR Library, plenty of examples.
Raman Spectroscopy_ Database of Minerals , very detailed from the USGS.
USGS Spectroscopy Lab - home page
Canadian HCFI research at Calgary,
Geophysical journals & societies:
American Association of Petroleum Geologists, diverse links.
American Petroleum Institute Home Page
Applied Geophysics ......this is linked through the publisher's website.
Geochimica et Cosmochimica Acta......this is linked through the publisher's website.
Geological Society of America......check it out, good.
Geological Society of London......check it out, good.
Institute of Petroleum - Oil and Gas Information
General sites:
Calsep A_S Home Pages
Direct Geochemical Home Page
Geobyte Home Page,
Houghton Mars Project, lots of stuff.
Hydrocarbon Online
PETROLEUM EXPLORATION TECHNOLOGIES
Rockall Studies Group, Ireland
Texas National Oil Repository
XVI ECROFI